
The Cup Size Psychology: How to Price 12oz, 16oz, and 24oz Drinks to Boost Margins for Food Service Operators
Small cafe and food truck operators can protect margins by treating their 12oz, 16oz, and 24oz drink sizes as a deliberate pricing ladder rather than applying a simple markup across the board. The key is to align each size with its role in customer choice while making sure contribution margin stays healthy at every tier, especially as ingredient, labor, and packaging costs fluctuate.
Why Cup Size Pricing Needs More Than a Simple Markup
Many operators default to a flat percentage markup on drink costs, yet this approach often fails to protect real profitability. As Cornell’s menu engineering research shows, the most popular item is not always the most profitable one. Menu engineering helps cafes balance contribution margin and popularity when setting drink prices.
True drink cost includes more than just ingredients. Labor time to prepare each size, the cost of the disposable cup and lid, and overhead all affect the final margin. A University of Massachusetts study on coffee shop operations using activity-based costing demonstrates that accurate pricing must reflect total recipe cost, labor, packaging, and overhead rather than relying on static markups alone. A defensible drink price should reflect total recipe cost, labor, packaging, and overhead, not just a simple markup.
Without this fuller picture, the largest size can quietly become the lowest-margin option even when it drives the highest volume. This is especially risky for independent cafes and food trucks where rising costs quickly erode thin profits. The solution starts with understanding how customers actually compare sizes: by perceived value rather than cost per ounce.
How Cup Size Psychology Changes What Customers Choose
Customers rarely calculate ounces per dollar. They respond to how sizes are labeled, ordered on the menu, and visually presented. Research published in the National Library of Medicine confirms that portion-size descriptions and pricing strategies can affect which portion consumers choose. The way a drink size is labeled and priced can influence whether customers choose the smaller, middle, or larger option.
This means the same 16oz drink can feel like a better deal when it sits between a noticeably smaller and a substantially larger option. Menu order and visual hierarchy also play a role. Placing the target size in the middle or highlighting it slightly can nudge more customers toward it without changing recipes. For small operators, these low-cost presentation tweaks often deliver faster results than recipe reformulation.
Keep in mind that willingness to pay varies by customer segment and occasion. Some guests prioritize value while others seek the “right” size for their needs. Your job is to make the profitable choice feel like the natural one.
How to Structure 12oz, 16oz, and 24oz as a Three-Tier Ladder
Treat the three sizes as a local pricing architecture with clear roles rather than a universal formula. The 12oz typically functions as the standard or entry-level reference. The 16oz often works best as the target or center option when you want most customers to choose it. The 24oz serves as the premium tier only when your local costs and demand allow it to carry appropriate contribution margin.
The exact gaps between prices must be tested locally. Evidence from behavioral studies supports using a middle option to steer choice, but the effect is not guaranteed in every cafe setting. A well-designed middle option can shift customers toward the size you want them to choose. Price-based decoys have been studied in menu contexts, yet success depends on clear value differences between tiers rather than arbitrary gaps.
Three-Tier Ladder for 12oz, 16oz, and 24oz by Local Recipe Cost
Local cost inputs and menu engineering principles suggest a tiered fit map for standard, target, and premium roles.

Three-Tier Ladder for 12oz, 16oz, and 24oz by Local Recipe Cost
Built from local cost guardrails and menu-engineering ladder logic, using tiered suitability to show role fit across recipe-cost scenarios.
This chart visualizes relative tier suitability across different recipe cost levels. Higher numbers indicate stronger alignment with standard, target, or premium roles in typical setups. Use it as a planning guide and always validate with your own sales data.
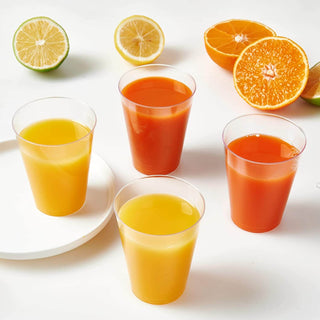
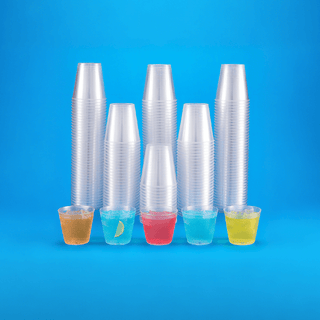
A clear visual comparison of three drink cups in 12 oz, 16 oz, and 24 oz sizes with a simple menu-style presentation.
Markup Checkpoints That Protect Margin Across All Three Sizes
Before setting final prices, calculate the total cost for each size. Include ingredients, preparation labor, the disposable cup and lid, and a fair share of overhead. The same University of Massachusetts analysis emphasizes that pricing should reflect these full costs to maintain healthy margins. Effective pricing demands a holistic view of recipe costs, labor, and overhead, moving past the limitations of a simple markup approach.
Set a minimum contribution margin floor for every size rather than chasing a fixed markup percentage. Pay special attention to the 24oz option: when ingredient or labor costs scale faster than price, the largest size can unintentionally become your lowest-margin product. Menu engineering principles from Cornell recommend separating popularity from true profitability when reviewing your drink ladder. By employing menu engineering, cafes can strategically align an item’s market appeal with its actual profitability during the pricing process.

When Decoy Pricing Helps—and When It Backfires
A middle option priced to look attractive compared with the smallest and largest sizes can guide more customers toward your target choice. Studies on priced decoys in menus support this idea in principle, yet real-world results vary.
The tactic backfires when gaps feel arbitrary or the middle size appears as a trap. Customers may lose trust if the pricing seems manipulative. Keep the structure transparent by making sure each size delivers clear value differences in portion, ingredients, or presentation. Ethical choice architecture works best when paired with local testing rather than assumed to deliver automatic uplift.
How to Test Your Drink Ladder Without Risking Sales
Test one variable at a time—price gaps, label order, or visual emphasis—over a short period such as one or two weeks. Track the mix of sizes sold, average order value, and contribution margin before and after the change. Watch for unintended trade-downs where customers shift to lower-margin options.
For food trucks and small cafes with limited menu space, simple A/B tests on printed menus or digital boards provide useful data without major reprints. Combine sales data with brief customer feedback to understand why certain sizes gain or lose popularity. This low-risk approach lets you refine the ladder without guessing.
Pricing Audit Checklist for 12oz, 16oz, and 24oz Menus
Before launching or updating your drink menu, run through this checklist:
- Confirm each size has a distinct role: 12oz as standard reference, 16oz as target when margins support it, and 24oz as premium only when costs and demand justify higher pricing.
- Verify the largest size maintains acceptable contribution margin and does not become the cheapest per ounce by accident.
- Check that price gaps between sizes feel logical and proportional rather than arbitrary.
- Ensure menu wording, order, and visual layout make the target size easy to choose.
- Calculate total drink cost including cups, lids, labor, and overhead for each size.
- Plan a short test period to measure size mix and profitability after changes.
There is no universal best price for these sizes because every cafe faces different recipes, rent, labor rates, and customer expectations. There is no universal best price for 12oz, 16oz, and 24oz drinks because margins depend on recipe, packaging, labor, rent, and customer base. Treat the ladder as a testable local system and revisit it whenever major costs change.
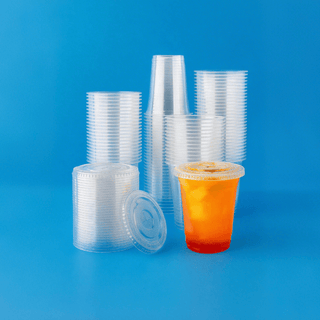
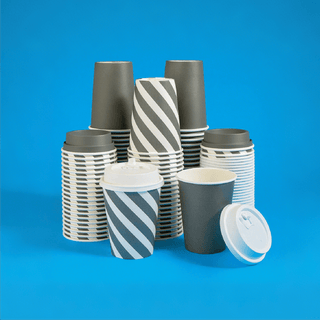
When you need reliable plastic cups to support your optimized menu, having the right disposable drinkware in stock prevents service delays and protects the presentation that reinforces your pricing strategy. For more practical guidance on choosing cups, see our guide on how to pick small paper cups for bulk orders. Food truck operators may also benefit from stackable plastic cups that save space while maintaining professional service.
FAQs
Q1:What is the best price difference between 12oz, 16oz, and 24oz drinks?
There is no single best difference. Price gaps should reflect your total drink cost, local customer price sensitivity, and the distinct value each size delivers. Test small changes and measure how the size mix and margins respond rather than copying another cafe’s structure.
Q2:Should the 16oz size always be the middle price option?
The 16oz size often works well as the target middle option when its contribution margin and popularity align with your goals. However, if most customers naturally choose the largest size or your costs make the 16oz less profitable, adjust the ladder so the target size remains the one that best protects overall margin.
Q3:Can decoy pricing be used ethically in a coffee shop?
Yes, when applied transparently as choice architecture that highlights genuine value differences between sizes. Avoid large arbitrary gaps that could feel manipulative. Focus on making the target size clearly attractive through portion, quality, or presentation rather than relying on psychological tricks alone.
Q4:How often should I review my drink size pricing?
Review pricing at least twice per year or whenever ingredient, labor, or packaging costs rise significantly. Seasonal cost changes, new cup suppliers, or shifts in customer traffic are also good triggers to audit your 12oz, 16oz, and 24oz ladder.
Q5:Does the 24oz size always need to be the most expensive?
Not necessarily. The 24oz should carry a premium price only when its total cost and contribution margin support it. If larger sizes drive high volume but deliver slim margins, you may need to adjust the recipe, cup cost, or pricing to prevent it from becoming your lowest-margin item.
Q6:What is the simplest way to test new drink prices without confusing customers?
Change only one element at a time—such as the price gap between 16oz and 24oz—on a single menu board or section of the counter for one to two weeks. Track size sales mix and average order value, then compare against your baseline data before rolling out broader changes.